No more paperwork and spreasheets
Uncover downtimes and automate your OEE calculationWhat is Overall Equipment Effectiveness?
What is OEE?
The definition of term Overall Equipment Effectiveness (OEE) was first introduced by Seiichi Nakajima in his 1988 book, “Introduction to TPM: Total Productive Maintenance”. Since then OEE has become a universal best practice for monitoring, evaluating, and improving the efficiency of production processes, whether it’s an assembly line, machine cell, packaging line, or filling machine.
Nakajima believed that achieving high productivity required not only advanced equipment and technology but also a strong collaboration between operators, engineers, and management to foster a culture of shared responsibility for equipment performance.
When all of your parts produced are good with no scrap - that is impressive, but it doesn’t mean your OEE equals 100%. How so? Let’s dive deeper in how it calculates
Efficiency or effectiveness?
While those terms are close, they differ when we compare them . Overall Efficiency is doing something using the least amount of time — producing the items with the least number of inputs to achieve the output. Effectiveness is producing the intended, the desired result. We can produce parts in five seconds for hours, but if they don't hold tolerance, we are not being effective.
Overall Equipment Efficiency Formula
OEE = Availability x Performance x Quality
Each factor is expressed as a percentage, and multiplying them gives a single OEE score, also as a percentage, which represents the overall efficiency of equipment..
OEE in Production - Availability, Performance, and Quality
Let’s imagine you are an automotive part manufacturer. After deciding to measure your efficiency, you have collected the following results:
|
Parameter |
Measured value |
|
Total scheduled work time |
2 shifts, 8 hours each |
|
Planned maintenance stops |
1 hour |
|
Total parts produced |
1200 pcs |
|
Quality reject |
30 pcs |
|
Cycle time (taken from NC program) |
24 s |
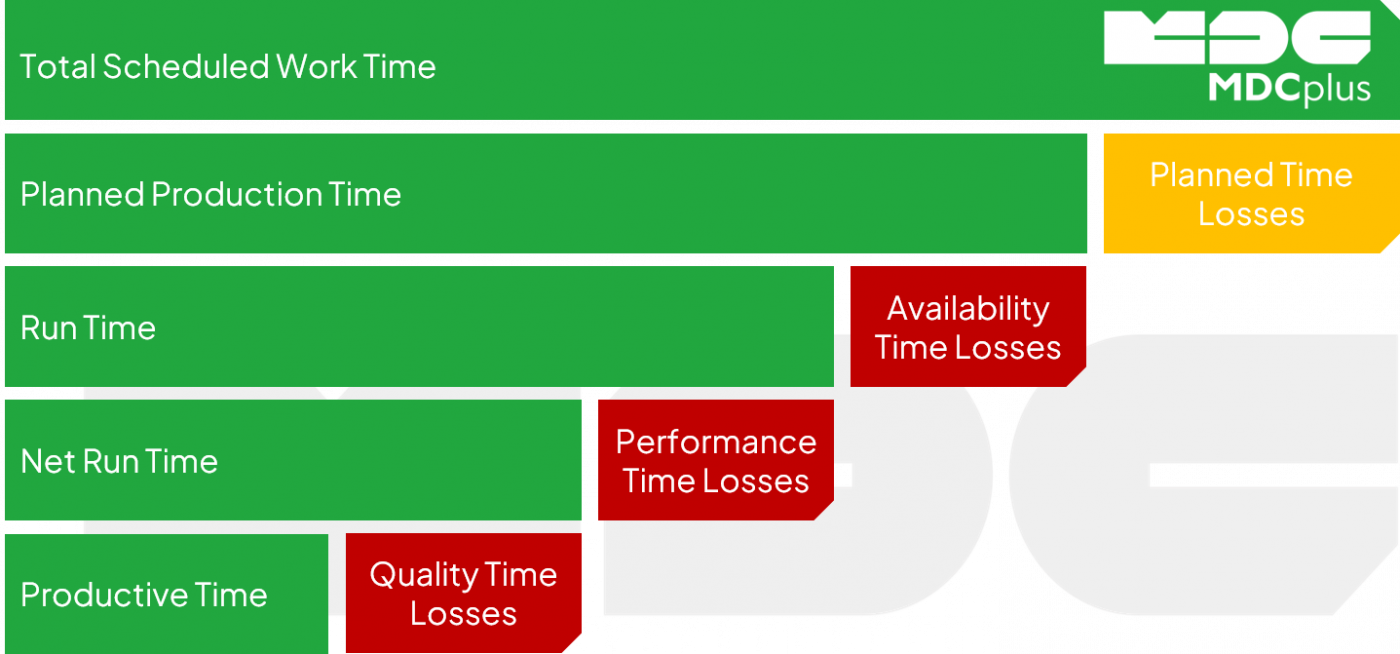
Let’s go step by step and learn how it helps, and what other data you will need to calculate your OEE. First, let’s build some knowledge about the time and how it is presented in the OEE view.
Any work starts from schedule, and that is what the biggest green line is about. Total Scheduled Work Time tells us, how many shifts you have, with what duration, and how many workday per month you have, or any chosen period
Planned Time Losses shows which part of your schedule is dedicated to keep your site working as expected.
It leads us to understanding which time part we expect production to make parts, calling in Run Time.
Excess time when machinery stopped working adds up to losses in Availability, showing us the time when the machinery actually runs making parts.
But workers can adjust the NC program, to run slower, or clean the debris from time to time. That is another loss to Performance time, resulting in Net Run Time.
And last but not least, to sort the low quality parts from all the amount requires time, and showing us the real core of Productive time - 100% verified time when you produce quality parts.
What is Availability in OEE
Availability focuses on planned production time and evaluates how effectively it is utilized. It represents the proportion of planned running time that is available for production. According to Nakajima, availability considers downtime events that halt production, providing insights into overall operational efficiency. Losses in this category include both unplanned and planned stops, though the specifics may vary depending on the OEE calculation method.

For this you will need to figure out the actual run time of your machinery. Based on your collected data, you already know that you have planned 15 hours production time. Your workers reported that there was 3 hours of unplanned downtime during the 2nd shift, leaving you with 12 hours of run time. In this case you availability is
Availability = Run time / Planned production time=12 hours / 15 hours = 0.8 = 80%
What is Performance in OEE
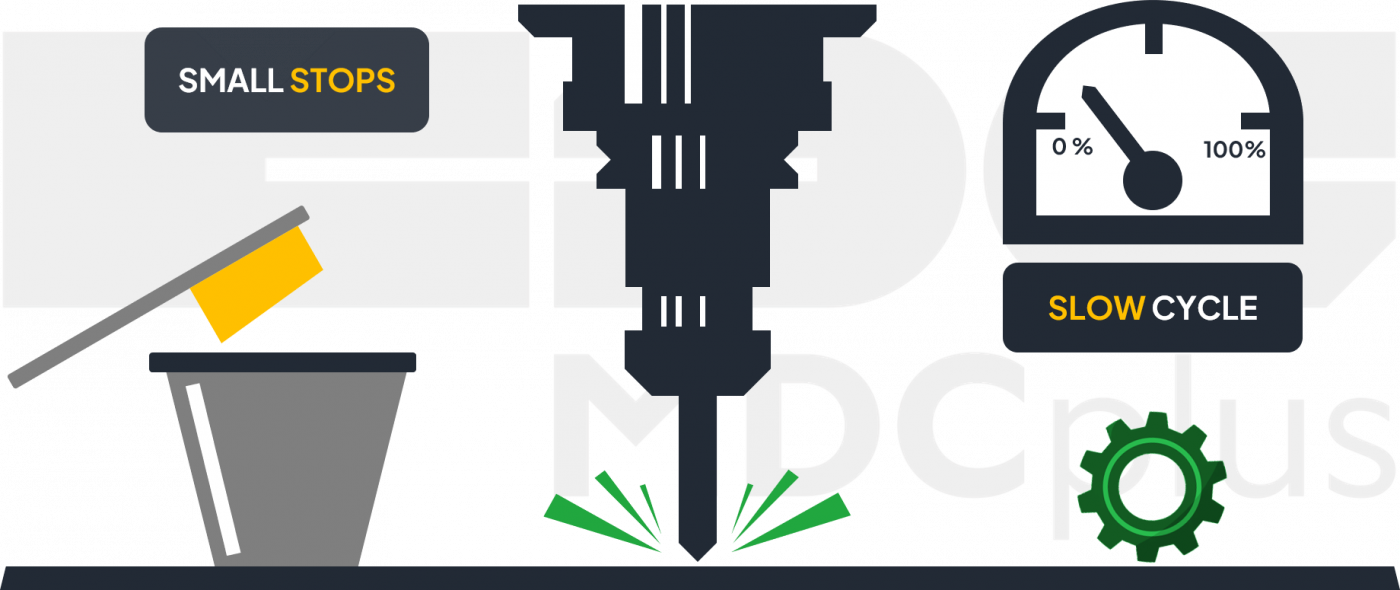
Performance, the second component of OEE, measures the speed at which the manufacturing process operates compared to its maximum potential. It compares the actual running speed of the plant or equipment to its specified operating speed, often referred to as the "Maximum Demonstrated Rate" (MDR) or "ideal cycle time." Performance is calculated as the actual throughput during the time the equipment ran versus the maximum throughput achievable at the MDR. This component helps identify whether more products could have been produced during the allocated production time. Performance losses are categorized as micro stops and slow cycles, with common causes including machine wear, substandard materials, misfeeds, and jams.
Make sure that your expected outcome is aligned with cycle time. Why is it important? Because the truth behind the production speed is cycle time, leading you directly to the higher limit of your production possibility. For this case we will need to convert cycle time into parts per hour, and get the following results
Performance =Amount of produced parts / Expected amount of produced parts = 1200 parts / (12 hours x 150 parts per hour) = 0.67 = 67%
What is Quality in OEE
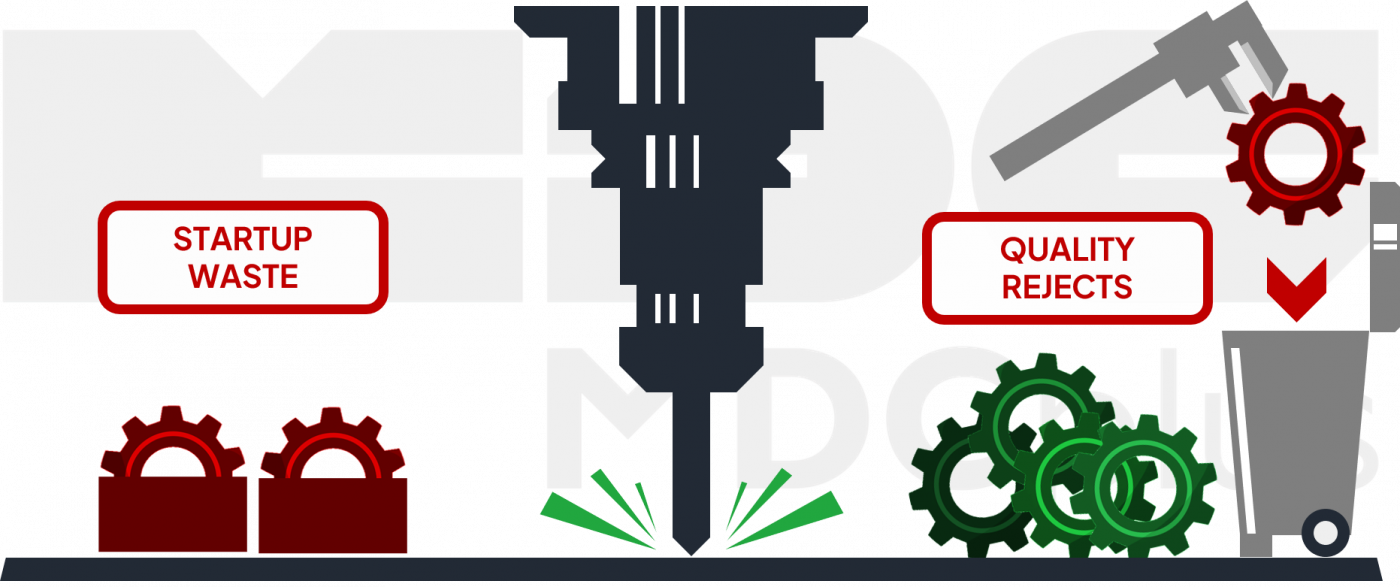
The third component of OEE is quality, which measures the proportion of production throughput that meets customer specifications and is correct on the first attempt. Quality losses are categorized into production rejects and start-up rejects, highlighting the waste caused by defective products. This metric evaluates the ratio of products meeting quality standards to the total produced, providing critical insights into inefficiencies. Examples of quality losses include scrap materials and parts requiring rework.
When you know your quality reject percentage, you can calculate the amount of accepted parts, but as well that represents your Quality value. Otherwise it can be done like this
Quality= Good parts / All parts= 1170 parts / 1200 total parts = 0.98 = 98%
That leads your to your OEE calculation of
OEE = Availability x Performance x Quality = 80% x 67% x 98% = 52%
Lower than it was expected, right? Let’s learn how to calculate it faster, and learn more about time losses.
Simplified OEE calculation
To calculate OEE using a simplified formula, focus on the relationship between good parts produced, the ideal cycle time, and planned production time:
OEE= Good parts x Ideal cycle time / Planned production time
- Good Parts
Start by identifying how many good parts were produced during the shift. This is the total number of parts produced minus any defective or rejected parts. Good parts represent the effective output that meets quality standards. - Ideal Cycle Time
The ideal cycle time is the expected time required to produce one unit under perfect conditions. This is usually determined by machine specifications or the production program. Multiplying the ideal cycle time by the number of good parts gives you the theoretical production time if everything ran perfectly. - Planned Production Time
Planned production time is the total time scheduled for production, excluding breaks or planned stops. This represents the maximum time available for productive work. - Calculate OEE
Multiply the number of good parts by the ideal cycle time, and divide this value by the planned production time. The result is the OEE percentage, which reflects how effectively the production time is being utilized to produce quality products at an efficient speed.
Now we can go step by step using the inital values from the table:
-
Good part = Total Count − Reject Count = 1200 pcs - 30 pcs = 1170 pcs
-
In our case it is known from NC program being 24 s/part
-
Planned production time = Shift Length − Breaks = 16 hours -1 hour = 15 hours
-
OEE = Good parts x Ideal cycle time / Planned production time= 1170 parts x 24s per part / 15 hours = 0.52 = 52%
Interpreting OEE Scores
- 85% and above: World-class performance.
- 60%–84%: Room for improvement.
- Below 60%: Requires significant attention
Six Big Losses in OEE - Production Downtimes
All of them are hiding behind the big three of Availability, Performance and Quality, but it is crucial to know them all.
OEE Availability Losses
|
Availability Losses |
|
|
Planned stoppages |
Unplanned stoppages |
|
|
Performance Losses
|
Performance Losses |
|
|
Small stops |
Slow cycles |
|
|
In the category of Performance Losses, Small Stops represent frequent minor interruptions, like a machine pausing briefly due to a product misalignment or a sensor error. Slow Cycles occur when equipment operates below its optimal speed, such as running a machine slower to prevent overheating or due to suboptimal settings.
Quality Losses
|
Quality Losses |
|
|
Startup waste |
Quality rejects |
|
|
Quality Losses encompass Quality Rejects, which are products failing to meet quality standards and requiring rework or scrapping—for example, defective parts caused by incorrect machine calibration or raw material issues. Startup Waste refers to defective products generated during the initial phase of machine operation, like scrapped units produced during the warm-up period.
Implementing OEE solution in manufacturing - from theory to practice
Achieving optimal manufacturing efficiency begins with understanding and implementing Overall Equipment Effectiveness (OEE). It’s more than just a calculation; it’s a strategic approach to improving productivity, reducing downtime, and maximizing quality. Here’s how manufacturers can transition from OEE theory to practical application.
1. Define Your “Why?”
The first step in implementing OEE is understanding the core problem it aims to solve. Is your primary challenge related to unplanned downtime, inefficient processes, or poor product quality? By identifying the key pain points, you can tailor your OEE strategy to address specific inefficiencies. This clarity helps align your team’s efforts and ensures that OEE implementation has a direct impact on operations.
2. Appoint an OEE Champion
Successful implementation requires ownership and accountability. Nominate a dedicated OEE ‘champion’—a team member responsible for overseeing the process from start to finish. This individual will act as the central point of contact, ensuring smooth coordination, tracking progress, and driving the initiative toward achieving measurable results.
3. Create a Pilot OEE Project
Begin by focusing on a specific machine or production line. This pilot project allows you to test and refine your OEE approach on a manageable scale. By monitoring and analyzing data from the selected equipment, you can identify patterns, measure improvements, and build a case for scaling OEE implementation across the entire facility.
4. Set Clear and Accessible Goals for OEE project
Establishing well-defined goals is critical for motivating teams and tracking success. These goals should be realistic, measurable, and directly tied to key business outcomes, such as increasing availability, boosting performance, or improving product quality. For example, a goal could be to reduce unplanned downtime by 15% within six months.
5. Focus on Resource Optimization
A successful OEE strategy always considers how to make the best use of available resources. This involves minimizing waste, optimizing energy consumption, and ensuring machines operate at peak performance. By improving resource utilization, manufacturers can enhance their bottom line and sustain long-term efficiency gains.
Ready to boost your OEE for free?
Get your demo projectQuick summary to OEE
Overall Equipment Effectiveness (OEE) measures manufacturing efficiency using three key factors: Availability, Performance, and Quality. Each factor aligns with specific types of production losses, helping identify and address inefficiencies. Calculation formula is:
OEE = Availability x Performance x Quality x 100%
Availability Loss:
Availability is the ratio of Run Time to Planned Production Time, accounting for:
- Unplanned Stops (e.g., equipment failure, breakdowns).
- Planned Stops (e.g., setup changes, maintenance).
100% Availability means no downtime during scheduled production time.
Performance Loss:
Performance is the ratio of Net Run Time to Run Time, addressing:
- Small Stops (e.g., material jams, misalignments).
- Speed Loss (e.g., slower cycles, suboptimal settings).
100% Performance means running at maximum speed without interruptions.
Quality Loss:
Quality is the ratio of Fully Productive Time to Net Run Time, covering:
- Process Defects (e.g., scrap, rework).
- Startup Waste (e.g., defects during warm-up).
100% Quality means no defective parts or rework.
By focusing on these factors, OEE simplifies complex productivity issues, guiding improvements in manufacturing efficiency. The most crucial for the is to collect real equipment data from day to day, otherwise your calculation will not show you the the dynamic to fix the problem roots.
About MDCplus
Our key features are real-time machine monitoring for swift issue resolution, power consumption tracking to promote sustainability, computerized maintenance management to reduce downtime, and vibration diagnostics for predictive maintenance. MDCplus's solutions are tailored for diverse industries, including aerospace, automotive, precision machining, and heavy industry. By delivering actionable insights and fostering seamless integration, we empower manufacturers to boost Overall Equipment Effectiveness (OEE), reduce operational costs, and achieve sustainable growth along with future planning.
Ready to increase your OEE, get clearer vision of your shop floor, and predict sustainably?


