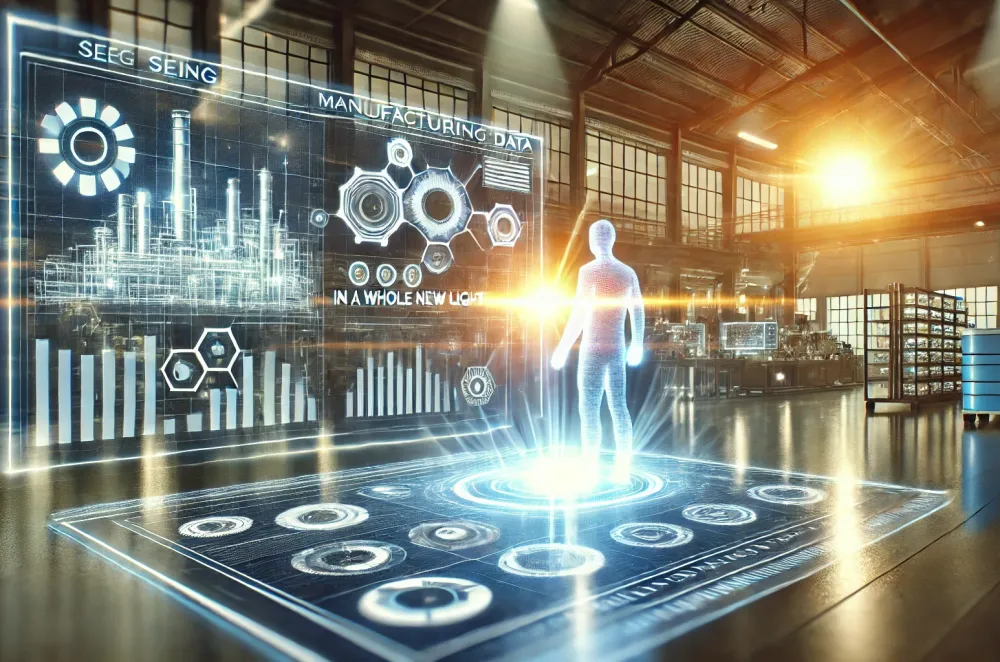
See Your Manufacturing Data in a Whole New Light: Tools and Techniques for Crystal-Clear Insights
Hey there, champions of the manufacturing world! Ever felt like you’re swimming in an ocean of data, trying to catch a glimpse of that actionable insight fish? You're not alone. The good news? Manufacturing data visualization is here to turn that overwhelming data deluge into a stream of clear, actionable insights. And yes, tools like MDCplus are part of this transformative journey. Let’s explore how visualizing your manufacturing data can not only improve decision-making but also illuminate paths to efficiency and innovation you never knew existed.
The Why Behind Data Visualization in Manufacturing
In an industry where precision and efficiency are paramount, making sense of complex data quickly is crucial. Data visualization steps in as your beacon, transforming rows of intimidating numbers into intuitive, easy-to-understand visual formats. Why does this matter? Because when data speaks clearly, making informed decisions becomes exponentially faster and more accurate.
Spotlight on Visualization Tools & Techniques
Dashboards: The heart of data visualization. Imagine having a customizable dashboard that not only displays key performance indicators (KPIs) in real time but also allows you to interact with the data, drilling down into specifics without missing a beat. Tools like MDCplus offer dashboards that bring your manufacturing data to life, highlighting trends, pinpointing inefficiencies, and shining a light on productivity.
Graphs and Charts: From bar charts illustrating production volume to line graphs showing trends over time, these are the staples of data visualization. They transform complex datasets into digestible visual summaries, making patterns and outliers unmistakable at a glance.
Heat Maps: Perfect for spotting variations across different shifts or machinery, heat maps use color gradients to represent data density or intensity, making it easy to identify hotspots of activity or concern.
Geospatial Maps: For manufacturers with multiple facilities or a global supply chain, geospatial maps provide a bird’s-eye view of operations, helping to visualize geographical data and logistics insights.
Leveraging Visualization for Enhanced Insights
But how exactly does one leverage these tools and techniques for maximum impact? Here are some tips:
Start with Your Goals: Identify what insights you’re after. Is it reducing downtime, optimizing production flow, or improving quality control? Your objectives will guide the visualization strategy.
Integrate Your Data Sources: Consolidate data from various sources for a holistic view. Platforms like MDCplus excel here, seamlessly gathering data from different machinery and systems.
Customize for Your Audience: Tailor your visualizations to the needs of different stakeholders. What a floor manager needs to see can differ vastly from what’s required at the executive level.
Keep It Interactive: Static charts have their place, but interactive visualizations that allow users to explore the data can uncover deeper insights.
Use the Right Tools: Not all visualization tools are created equal. Choose tools that offer the flexibility, scalability, and depth needed to match your manufacturing complexity. MDCplus, for instance, provides a robust platform for not just visualizing but also analyzing manufacturing data in real time.
The Visual Future of Manufacturing
As we forge ahead in the Industry 4.0 era, the role of data visualization in manufacturing only grows stronger. It’s about making data not just accessible but also meaningful and actionable. With the right tools and techniques, those once-overwhelming data oceans become navigable waters, leading to informed decisions, optimized operations, and a competitive edge that’s as clear as day.
So, are you ready to visualize your way to manufacturing excellence? Embrace the power of data visualization, and let tools like MDCplus light the way to insights you never thought possible. Welcome to the future of manufacturing, where data doesn’t just inform; it transforms.
Interested in digital transformation? Let's discuss!
Other articles
Let’s break down why - and how the right data layer transforms ERP from a passive system into a real-time production command center.
What you need is a clear, realistic path and that’s what this article is about. We’ll break it down into three practical levels of growth. No fluff. No “just buy a robot” advice. Just the kind of steps you can take, whether you’re on your first machine or a few years in and trying to level up.
