Calibrate your system to your needs. Try MDCplus
Try it yourself Get guided demo26 June 2026
Sampling Rate and Data Granularity Explained
How sampling rate and data granularity affect machine monitoring: the trade-offs between polling frequency, storage, and what you can actually detect, with practical guidance for choosing rates
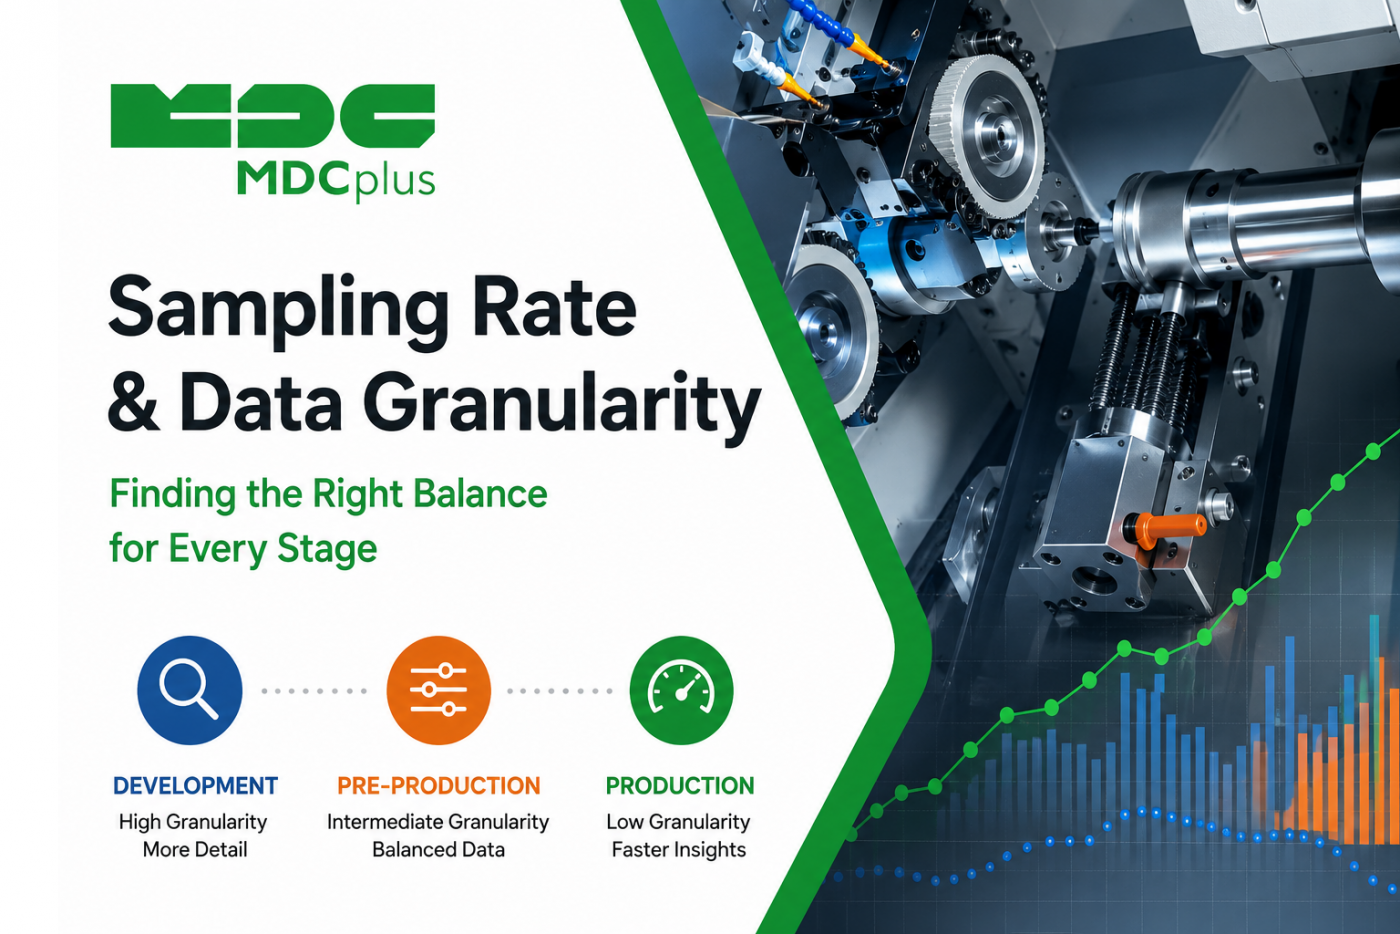
How often should a monitoring system check a machine's status?
The honest answer is "it depends," but that's rarely a satisfying answer when you're actually configuring a system. Sampling rate and data granularity determine what a monitoring setup can and can't detect, how much storage and bandwidth it consumes, and ultimately how trustworthy its metrics are. This article explains the trade-offs and gives a practical framework for choosing rates that fit the questions you actually need answered.
Contents:
- What sampling rate and granularity actually mean
- Why the trade-off matters
- Event-driven vs. polling-based collection
- Typical rates by data type
- How granularity affects specific use cases
- A practical framework for choosing a rate
- Common mistakes
- Frequently asked questions
- Conclusion
What sampling rate and granularity actually mean
Sampling rate is how frequently a value is read or recorded — once per second, once per minute, only when it changes. Granularity is the closely related idea of how fine-grained the resulting data is once stored: a system polling spindle load every second produces much finer-grained data than one that only logs a daily average. The two concepts move together in practice: a higher sampling rate generally produces finer granularity, at the cost of more data to transmit, store, and process.
Why the trade-off matters
Sample too infrequently and short-lived events disappear entirely — a thirty-second micro-stop between two one-minute polling cycles may never register as a distinct event. Sample too frequently, especially across a large fleet, and you generate far more data than most use cases need, straining network bandwidth, storage costs, and the processing required to make sense of it all. Neither extreme is automatically wrong; the right rate depends entirely on what a specific signal is being used for, which is why a single blanket polling interval across every data point on every machine is rarely the best choice.
Event-driven vs. polling-based collection
Not all data collection works on a fixed timer. Two general patterns show up across the protocols covered elsewhere on this blog:
- Polling means a client actively asks a device for a value on a schedule — every second, every five seconds, whatever interval is configured. Modbus TCP and much of MC Protocol/SLMP work this way by default.
- Event-driven (subscription-based) collection means the device notifies the client when a value changes, rather than waiting to be asked. OPC UA supports this through its subscription mechanism, which can be more efficient than polling since it avoids repeatedly asking for a value that hasn't changed.
Event-driven collection generally produces better granularity for state changes without the overhead of high-frequency polling, but it depends on the underlying protocol and device actually supporting it — not every interface offers this option.
Typical rates by data type
| Data type | Typical approach | Why |
|---|---|---|
| Program/cycle status | Event-driven, or polling every 1–5 seconds | State changes are relatively infrequent but need to be captured promptly for accurate Availability data |
| Spindle load / feed rate | Polling every 1–5 seconds | Useful for trend analysis without needing sub-second resolution in most cases |
| Vibration (for predictive maintenance) | Continuous or very high-frequency sampling (hundreds of Hz or more) | Mechanical fault signatures often only show up at high sampling rates well beyond typical status polling |
| Power/energy consumption | Polling every 1–60 seconds depending on use case | Trend and consumption tracking rarely needs sub-second resolution; billing-grade metering may differ |
| Alarms | Event-driven where possible | Missing or delaying an alarm event defeats much of its purpose |
How granularity affects specific use cases
- Micro-stop detection for OEE. As covered in our piece on machine signals for OEE, short pauses that fall between polling intervals simply won't be captured, quietly inflating Performance and Availability numbers. This is one of the more common reasons an OEE figure looks better than the shop floor actually feels.
- Predictive maintenance. Detecting early signs of bearing wear or mechanical imbalance from vibration data typically requires sampling rates far higher than what's used for basic status monitoring — standard 1-second polling won't reveal a fault signature that only appears at high frequency.
- Cycle time accuracy. Precise cycle time measurement benefits from event-driven detection of program start/stop rather than coarse polling, since polling error directly adds noise to a measurement that's often used for tight Performance calculations.
- Long-term trend analysis. Trends like gradual power consumption drift or slow tool wear over weeks don't need high-frequency data at all; coarser, aggregated sampling is often sufficient and considerably cheaper to store.
A practical framework for choosing a rate
- Start from the question, not the technology. Ask what decision or metric a given piece of data is meant to support before picking a rate — "how often does this need to be accurate to" is a more useful question than "how often can we poll it."
- Use event-driven collection wherever it's supported. It typically gives better accuracy for state changes without the overhead of aggressive polling.
- Reserve high-frequency sampling for signals that specifically need it. Vibration for predictive maintenance is a genuine exception; most status and trend data doesn't require the same resolution.
- Consider aggregating at the edge rather than storing everything raw. Summarizing high-frequency data locally before it's transmitted can preserve the useful signal (peaks, averages, thresholds crossed) while reducing what needs to travel and be stored long-term.
- Revisit rates as fleet size grows. A polling interval that's reasonable for ten machines can become a real network or storage burden at a hundred; sampling strategy is worth reviewing periodically, not just set once.
Common mistakes
- One universal polling interval for everything. Applying the same rate to program status and vibration data means either over-sampling the former or under-sampling the latter.
- Assuming higher is always better. Beyond a certain point, additional sampling frequency adds cost without adding meaningfully useful information for most use cases.
- Not accounting for aggregation when interpreting historical data. Data that's been averaged or downsampled for storage can hide the very micro-events (like short stops) that a report later assumes are captured.
- Ignoring device-side limits. Some older controllers or PLCs can't reliably sustain very high polling frequencies without affecting their own performance; check documented limits before configuring an aggressive rate.
Frequently asked questions
What's a reasonable default polling rate if I'm not sure what I need?
For general status and trend data (program state, spindle load, feed rate), polling every 1 to 5 seconds is a common, reasonable starting point for most monitoring use cases. Special cases like vibration-based predictive maintenance need much higher rates, and that should be identified specifically rather than assumed.
Does higher sampling rate always mean more accurate metrics?
Only up to the point where the sampling rate matches what the underlying event actually requires. Sampling program status every 100 milliseconds instead of every second rarely improves Availability accuracy meaningfully, since program state doesn't change that fast in the first place.
How does sampling rate affect storage costs?
Directly and often significantly — higher-frequency data multiplies the volume of time-series records generated. Aggregating or downsampling data that doesn't need full resolution for long-term storage is a common way to control this without losing the data that actually matters for reporting.
Can sampling rate be different for the same signal depending on machine state?
Yes, and some systems do this deliberately — sampling more frequently during active cycles and less frequently when a machine is idle, which balances data completeness against unnecessary volume during periods where little is changing.
Conclusion
Sampling rate isn't a single setting to configure once and forget — it's a deliberate trade-off between what you can detect, how much data you generate, and what that data actually needs to support. Matching the rate to the specific question each signal is meant to answer, rather than applying one interval across everything, is what separates a monitoring setup that reliably captures what matters from one that either misses short-lived events or drowns in data nobody uses.
Related articles:
- What Machine Signals Matter for OEE
- CNC Data Acquisition: Architecture Basics
- OPC UA for CNC Data Collection: A Guide
- Modbus TCP for Machine Monitoring
- MDCplus Machine Connectivity & Integrations
About MDCplus
Our key features are real-time machine monitoring for swift issue resolution, power consumption tracking to promote sustainability, computerized maintenance management to reduce downtime, and vibration diagnostics for predictive maintenance. MDCplus's solutions are tailored for diverse industries, including aerospace, automotive, precision machining, and heavy industry. By delivering actionable insights and fostering seamless integration, we empower manufacturers to boost Overall Equipment Effectiveness (OEE), reduce operational costs, and achieve sustainable growth along with future planning.
Ready to increase your OEE, get clearer vision of your shop floor, and predict sustainably?
Other articles
14.08.2026
How Do You Build a Mobile Dashboard Plant Managers Actually Use?
Building a mobile-first Tailwind PWA for plant managers: what belongs on a phone screen, offline behavior, push notifications, and prompts for an executive manufacturing dashboard
Read more
13.08.2026
How Do You Create Manufacturing KPI Widgets with Cursor and v0.dev?
Using v0.dev to generate manufacturing KPI widgets and Cursor to wire them into an existing dashboard repo: the two-tool workflow, prompts for scrap rate and MTTR/MTBF, and integration pitfalls
Read more
12.08.2026
How Do You Build a 3D Shop Floor Map Driven by Live PLC Data?
Building a 3D shop floor map with React Three Fiber: preparing CAD geometry for the web, mapping PLC tags to mesh colors, performance limits, and when 3D is the wrong choice.
Read more
11.08.2026
How Do You Design an Andon Display For Shop-Floor Using AI?
Prompting UI/UX for shop floor Andon displays: type scale for distance viewing, colorblind-safe status coding, glare and glove constraints, and prompts that produce factory-ready screens
Read more
10.08.2026
How Do You Get Live OPC UA Machine Data into Retool?
How to vibe-code a Retool custom component that streams live OPC UA machine data over WebSockets: the bridge service, security boundaries, and prompts for each layer
Read more