Make production transparent. Try MDCplus
Try it yourself Get guided demo30 June 2026
Time-Series Data from Machines: A Practical Guide
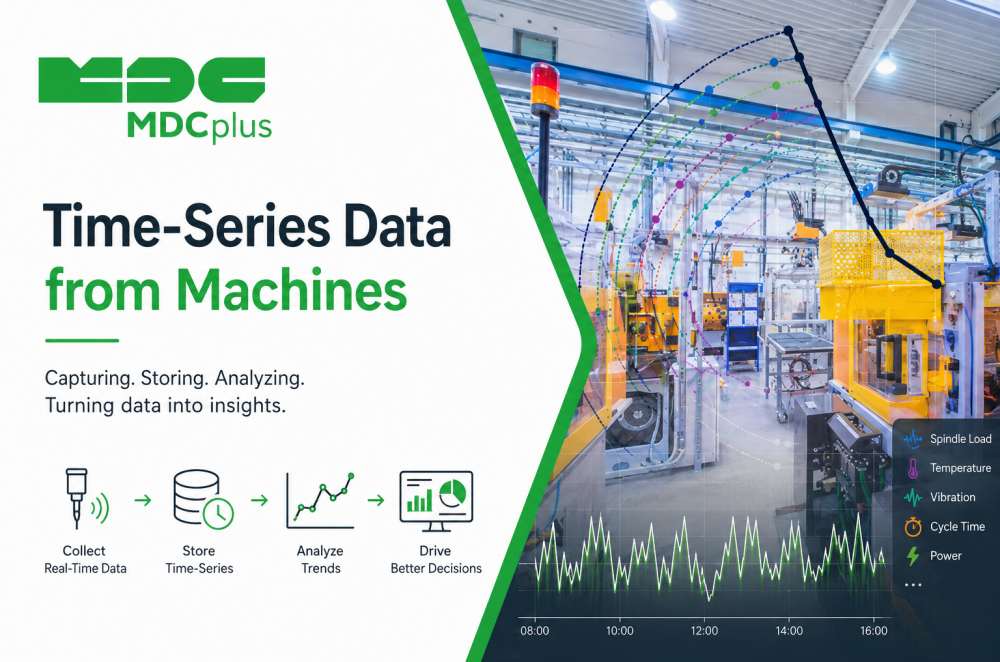
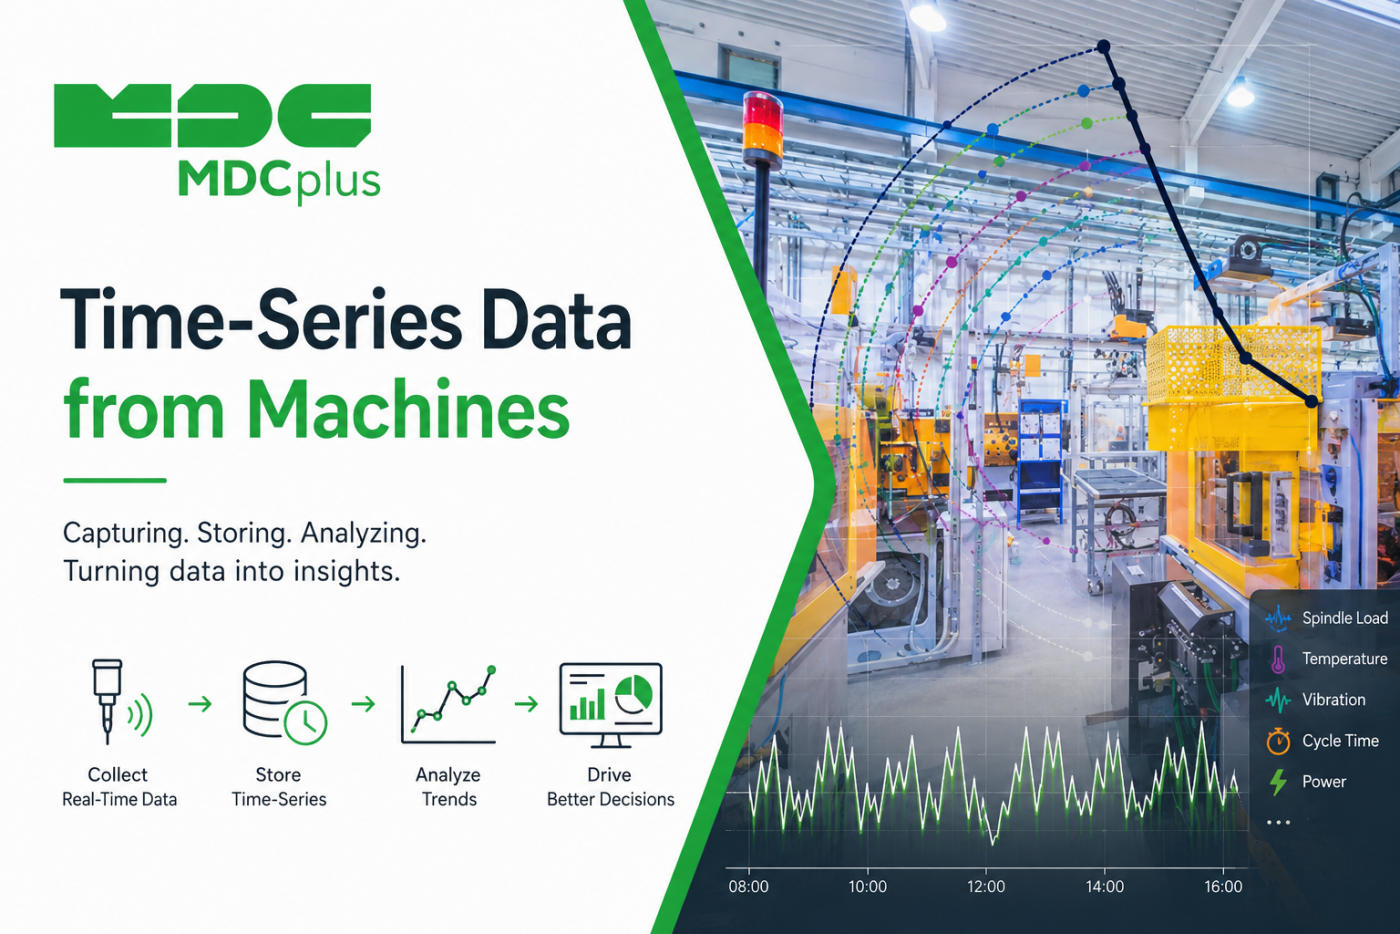
What time-series data is, why machine monitoring data is inherently time-series, how it's structured and queried, and what to consider for retention and downsampling
Why it's important to structure your data?
Almost everything a monitoring platform stores about a machine is, structurally, the same kind of data: a value, tied to a timestamp, tied to a specific machine and signal. That structure has a name — time-series data — and understanding it explains a lot about how monitoring platforms are built, why some queries are fast and others slow, and what trade-offs come with keeping years of history versus a few weeks. This primer covers the basics.
Contents:
- What time-series data is
- Why machine data is inherently time-series
- How time-series data is typically structured
- Querying time-series data
- Retention and downsampling
- Common pitfalls
- Frequently asked questions
- Conclusion
What time-series data is
Time-series data is any sequence of data points indexed by time — a value recorded at 09:14:02, another at 09:14:03, and so on. It's a different shape from the relational, table-based data most business software is built around (customer records, orders, invoices), where a row typically represents one entity's current state rather than a value changing continuously over time. Stock prices, weather readings, and server performance metrics are all classic examples of time-series data outside manufacturing; spindle load, machine state, and power consumption are the manufacturing equivalent.
Why machine data is inherently time-series
Machine monitoring is fundamentally about change over time: when did the machine start running, how did spindle load vary during a cut, when did an alarm trigger and when did it clear. A single current-state snapshot ("the machine is running right now") answers almost none of the questions a manufacturer actually cares about — uptime percentage, cycle time trends, when a specific downtime event happened — all of which require the historical sequence, not just the latest value. This is why monitoring platforms are typically built around time-series storage rather than a simple table that just holds each machine's current status.
How time-series data is typically structured
- Timestamp — when the value was recorded, ideally with consistent precision and timezone handling across every source.
- Tags / identifiers — metadata describing what the value belongs to: machine ID, signal name (spindle load, program status), sometimes additional context like shift or operator.
- Field / value — the actual measurement or state at that timestamp.
Most time-series systems store data in this "long" or "narrow" format — one row per timestamp-tag-value combination — rather than a "wide" format with one column per signal, because it scales more naturally as new signals or machines are added without requiring the underlying table structure to change.
Querying time-series data
Time-series queries tend to look different from typical business database queries. Instead of "find the customer with this ID," a monitoring query is more often "what was the average spindle load between 9am and 10am," or "how many minutes was this machine in an alarm state yesterday." Common operations include:
- Windowed aggregation — averaging, summing, or counting values within fixed time buckets (per minute, per hour, per shift).
- Downsampling for display — reducing a large number of raw points into a smaller set suitable for rendering a chart without overwhelming the browser or the person reading it.
- Gap handling — deciding how to treat missing data (a sensor offline, a network interruption) rather than silently interpolating values that were never actually recorded.
- Time-range filtering — almost every query in a monitoring context is scoped to a specific time window, which is part of why time-series-optimized storage performs meaningfully better than general-purpose databases at this kind of workload as data volume grows.
Retention and downsampling
Storing every raw data point indefinitely gets expensive quickly, especially at higher sampling rates — a topic we cover more specifically in our piece on sampling rate and data granularity. A common approach is tiered retention: keep full-resolution raw data for a relatively short window (days to weeks, when detailed troubleshooting is most likely to be needed), then progressively downsample older data into coarser summaries (hourly or daily averages) for long-term trend analysis, discarding or archiving the original raw points. This balances storage cost against the reality that very few people query minute-by-minute spindle load from eighteen months ago, while trend data over that same period is often genuinely useful.
Common pitfalls
- Clock synchronization issues. If different machines or edge devices have clocks that drift out of sync, correlating events across them (did machine A's stop cause machine B's delay) becomes unreliable.
- Inconsistent timezone handling. Storing some timestamps in local time and others in UTC without clear conversion creates subtle, hard-to-spot errors in shift-based reporting.
- Treating gaps as zero. A sensor going offline should generally be recorded as missing data, not silently treated as "0" or "not running," which can distort downtime calculations.
- No retention plan until storage costs become a problem. Deciding on downsampling and retention policy after months of unmanaged raw data accumulation is far more painful than planning it from the start.
Frequently asked questions
Do I need a specialized time-series database for machine monitoring?
Not necessarily for small deployments, but as data volume and query frequency grow, purpose-built time-series storage generally performs significantly better than a general-purpose relational database for this specific workload. Most established monitoring platforms handle this choice internally rather than requiring the manufacturer to manage it directly.
How long should raw machine data be retained?
There's no universal answer, but a common pattern is full resolution for a few weeks to a few months, with downsampled summaries retained much longer for trend analysis. The right window depends on how often detailed historical troubleshooting is actually needed versus long-term reporting.
What happens to a metric like Availability when there's a gap in the underlying data?
This depends on how the platform handles missing data. A well-designed system distinguishes "no data available" from "machine was stopped," since treating a data gap as downtime (or as uptime) both distort the resulting metric in different, misleading ways.
Is time-series data the same thing as a "historian" in industrial software?
Largely yes — "historian" is a term long used in industrial automation for a system that stores time-stamped process and machine data, which is functionally the same concept as a time-series database, sometimes with domain-specific features layered on top.
Conclusion
Machine monitoring data is time-series data by nature, and understanding that shape — timestamped values tied to specific signals and machines — explains why monitoring platforms query and store data the way they do. Retention and downsampling decisions, in particular, are worth planning deliberately rather than discovering by accident once storage costs or query performance become a problem.
Related articles:
- Sampling Rate and Data Granularity Explained
- From Raw Signals to Useful Metrics
- CNC Data Acquisition: Architecture Basics
- MDCplus Machine Connectivity & Integrations
About MDCplus
Our key features are real-time machine monitoring for swift issue resolution, power consumption tracking to promote sustainability, computerized maintenance management to reduce downtime, and vibration diagnostics for predictive maintenance. MDCplus's solutions are tailored for diverse industries, including aerospace, automotive, precision machining, and heavy industry. By delivering actionable insights and fostering seamless integration, we empower manufacturers to boost Overall Equipment Effectiveness (OEE), reduce operational costs, and achieve sustainable growth along with future planning.
Ready to increase your OEE, get clearer vision of your shop floor, and predict sustainably?
Other articles
14.08.2026
How Do You Build a Mobile Dashboard Plant Managers Actually Use?
Building a mobile-first Tailwind PWA for plant managers: what belongs on a phone screen, offline behavior, push notifications, and prompts for an executive manufacturing dashboard
Read more
13.08.2026
How Do You Create Manufacturing KPI Widgets with Cursor and v0.dev?
Using v0.dev to generate manufacturing KPI widgets and Cursor to wire them into an existing dashboard repo: the two-tool workflow, prompts for scrap rate and MTTR/MTBF, and integration pitfalls
Read more
12.08.2026
How Do You Build a 3D Shop Floor Map Driven by Live PLC Data?
Building a 3D shop floor map with React Three Fiber: preparing CAD geometry for the web, mapping PLC tags to mesh colors, performance limits, and when 3D is the wrong choice.
Read more
11.08.2026
How Do You Design an Andon Display For Shop-Floor Using AI?
Prompting UI/UX for shop floor Andon displays: type scale for distance viewing, colorblind-safe status coding, glare and glove constraints, and prompts that produce factory-ready screens
Read more
10.08.2026
How Do You Get Live OPC UA Machine Data into Retool?
How to vibe-code a Retool custom component that streams live OPC UA machine data over WebSockets: the bridge service, security boundaries, and prompts for each layer
Read more