Make production transparent. Try MDCplus
Try it yourself Get guided demo07 August 2026
Can AI Generate a Grafana Dashboard for CNC Machine Monitoring?
How to prompt an AI model to generate a Grafana dashboard JSON model for CNC monitoring over MQTT: the data pipeline, panel design, Flux queries, and validating generated JSON
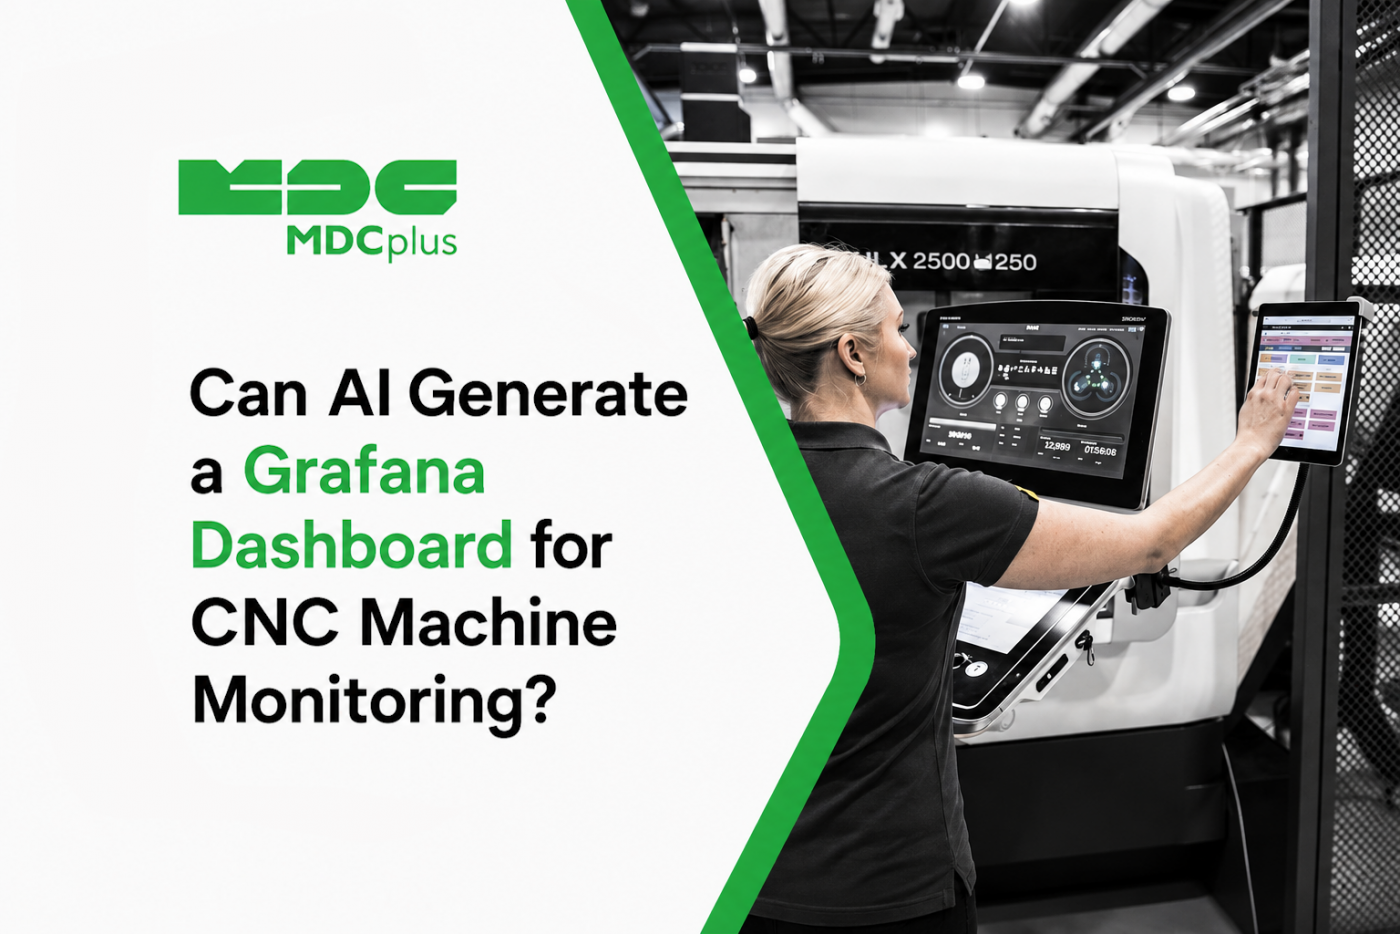
Short answer: yes, and generating the dashboard JSON model directly is often faster than building panels by hand — but it only works reliably if you supply the actual measurement and field names from your database rather than letting the model invent them. Grafana dashboards are just JSON, which makes them an unusually good target for AI generation: the model produces a file, you import it, and you see immediately whether it works. The failure mode is equally specific — panels that render perfectly but query fields that don't exist, showing "No data" with no obvious explanation. This article covers the pipeline, the prompts, and how to avoid that.
Copy this prompt to get started
Fill in the bracketed parts with your real schema before sending. Opus handles the full multi-panel JSON structure more reliably in one pass; Sonnet is good for iterating on individual panels afterward:
Generate a complete Grafana dashboard JSON model for CNC machine monitoring. Data arrives via MQTT and is stored in InfluxDB.
My actual schema: measurement name is [your measurement], tag keys are [machine_id, line, etc.], field keys are [spindle_load, spindle_override, axis_load_x, feed_rate, program_name, machine_state].
Use only these exact names — do not invent, rename, or add fields. If you need a field I haven't listed, stop and ask.
Include panels for: current machine state per machine (stat panel, color-coded), spindle override over time, axis load per axis, feed rate, and a table of recent alarms. Add a dashboard variable for machine selection so panels filter by the selected machine. Target Grafana schema version [your version]. Use Flux queries. End with a list of every assumption you made.
Contents:
- The pipeline: MQTT to Telegraf to InfluxDB to Grafana
- Why generating the JSON model works well
- Supplying your schema — the step that decides everything
- Panels worth including for CNC monitoring
- Prompting for correct Flux queries
- Dashboard variables and reusability
- Predictive maintenance alerts — and their limits
- Validating generated JSON before trusting it
- Common pitfalls
- Frequently asked questions
- Conclusion
The pipeline: MQTT to Telegraf to InfluxDB to Grafana
Before any dashboard exists, machine data has to get into something Grafana can query. A common stack for CNC monitoring looks like this:
- Machine to MQTT. An edge device reads the controller's native interface — FOCAS, OPC UA, or whatever the controller speaks — and publishes values to MQTT topics, as covered in our piece on streaming machine data with MQTT.
- Telegraf as the collector. Telegraf subscribes to the MQTT topics and writes the values into InfluxDB, handling parsing and tagging along the way.
- InfluxDB as storage. A time-series database suited to this shape of data — the trade-offs against relational storage are covered in SQL vs. time-series database.
- Grafana as the front end. Queries InfluxDB and renders the panels, as covered more generally in connecting machine data to Grafana.
AI generation helps most at the last step. The earlier stages involve protocol specifics and network configuration where, as covered in our piece on avoiding hallucinations in IIoT code, model output is least reliable and vendor documentation is the only authoritative source.
Why generating the JSON model works well
Grafana dashboards are defined entirely by a JSON document that you can import directly through the UI. That makes this an unusually favorable AI generation task for three reasons: the output format is well-documented and highly structured, the feedback loop is immediate (import it and look), and mistakes are cheap and reversible — a broken dashboard JSON breaks nothing but itself.
Compare this to generating the collection layer, where a mistake writes wrong data into your historian and may not be noticed for weeks. Dashboard JSON is squarely in the "let the model do it" category; the pipeline feeding it is not.
Supplying your schema — the step that decides everything
This is the difference between a dashboard that works on import and one that shows "No data" on every panel. Models have seen enough InfluxDB and Grafana material to produce entirely plausible measurement and field names — cnc_metrics, spindle_speed, machine_status — that have nothing to do with what's actually in your database.
The fastest way to get this right is to query your actual schema and paste the result into the prompt:
# InfluxDB 2.x - list measurements, then fields for one
import "influxdata/influxdb/schema"
schema.measurements(bucket: "your_bucket")
schema.measurementFieldKeys(bucket: "your_bucket", measurement: "your_measurement")
schema.measurementTagKeys(bucket: "your_bucket", measurement: "your_measurement")
Paste those outputs verbatim. It takes two minutes and eliminates the single largest category of failure in this workflow.
Panels worth including for CNC monitoring
| Panel | Type | Why it earns its space |
|---|---|---|
| Machine state | Stat, color-coded | The one thing anyone glancing at the screen actually wants |
| Spindle load / override | Time series | Reveals whether a program is running as intended or being manually slowed |
| Axis load per axis | Time series, multi-series | Trends here often precede mechanical issues |
| Feed rate | Time series | Pairs with spindle data to distinguish program vs. operator changes |
| Active alarms | Table | Immediate context for why a machine is in its current state |
| Utilization over period | Bar gauge | Rolls the live view up into something comparable across machines |
Resist asking for every possible panel in one prompt. Generating six well-specified panels produces better output than twenty vaguely-specified ones, and a dense dashboard querying dozens of series simultaneously also strains the data source.
Prompting for correct Flux queries
Flux queries are where generated dashboards most often go subtly wrong — not syntactically (that fails loudly) but semantically, producing a chart that renders something other than what you meant. Two specifics worth constraining explicitly:
For every Flux query: use
aggregateWindowwith an explicit aggregation function appropriate to the field —meanfor continuous values like spindle load,lastfor state fields like machine_state, nevermeanon a state or categorical field. SetcreateEmpty: falseso gaps in telemetry render as gaps rather than as interpolated or zero values. Do not fill missing data.
That last constraint matters more than it looks. A Grafana panel that interpolates across a telemetry outage draws a smooth line through a period where nothing was reported, which visually implies the machine was running normally — the exact "no data misread as zero" problem covered in our piece on shop floor data quality, rendered in chart form.
Dashboard variables and reusability
Ask for a template variable for machine selection in the first prompt rather than retrofitting it later. A single dashboard definition with a machine dropdown is dramatically easier to maintain than one dashboard per machine, and adding a new machine becomes a data question rather than a dashboard-editing task:
Add a dashboard variable named
machinepopulated dynamically from themachine_idtag values in the data, with multi-select and an "All" option. Every panel query must filter on this variable. Also add a variable for the aggregation window so viewers can switch between fine and coarse resolution without editing queries.
Predictive maintenance alerts — and their limits
Grafana's native alerting can be generated alongside the panels, and threshold-based alerts are a reasonable thing to prompt for: spindle load sustained above a limit, a machine reporting no data for longer than expected, axis load trending upward over a window.
Be precise about what this is, though. Threshold alerting on trends is condition monitoring, not predictive maintenance in the analytical sense — genuine predictive maintenance typically requires high-frequency vibration data and models trained on failure signatures, which is a different discipline from a Grafana threshold rule. It's worth prompting for these alerts and worth not overselling them internally as prediction. Also, as noted in our Grafana integration guide, alerts that matter operationally are generally better handled at the monitoring platform level too, rather than existing only in the visualization layer, which depends on Grafana itself staying up.
Validating generated JSON before trusting it
- Import into a non-production Grafana first. A malformed dashboard can't corrupt data, but it can clutter a production instance and confuse people who find it.
- Check every panel for "No data" specifically. This is the signature of invented field names. A dashboard where four of six panels render is a schema mismatch, not a partial success.
- Verify the time range behavior. Switch between a 15-minute and a 30-day range. Queries that look fine at one resolution sometimes break or become unusably slow at another.
- Confirm gaps render as gaps. Find a period where a machine was offline and check that the panel shows a break, not a line.
- Read the assumptions list. If you included that instruction, this is where undisclosed guesses surface.
Common pitfalls
- Schema version mismatch. Grafana's JSON model changes between major versions; generated JSON targeting a different version may import with missing or misconfigured panel options. State your version explicitly.
- Averaging state fields. Applying
meanto a categorical machine state produces a meaningless number that still renders as a chart. - Hardcoded machine IDs in panel queries. Without a template variable, every new machine means editing every panel.
- Panels querying enormous unaggregated ranges. Fine on a 15-minute view, painful on a 90-day one; specify aggregation windows that scale.
- Treating the generated dashboard as final. Generated JSON is a strong first draft. The panels people actually keep are usually the ones refined after a week of real use.
Frequently asked questions
Why does my AI-generated dashboard show "No data" on every panel?
Almost always invented measurement or field names. Query your actual schema, paste the real names into the prompt, and regenerate — this resolves the large majority of these cases.
Should I generate the whole dashboard at once or panel by panel?
Generate a small, well-specified set of panels in one pass to get the overall structure and variables right, then iterate panel by panel. Asking for twenty panels at once tends to produce shallower, more generic queries for each.
Can AI generate the Telegraf configuration too?
It can, but this is a higher-risk target than dashboard JSON — a misconfigured collector writes wrong data into your historian, which is much harder to notice and to undo than a broken panel. Generate it if you like, but review it carefully and validate against a small test bucket before pointing it at production storage.
Is InfluxDB required, or does this work with other backends?
The same approach works with any Grafana-supported data source — the pipeline and query language change (PromQL, SQL, or another dialect instead of Flux) but the workflow of supplying your real schema and constraining the model to it is identical.
Conclusion
Generating Grafana dashboard JSON is one of the highest-return AI tasks in this whole space: structured output, instant feedback, and cheap mistakes. The single thing that determines whether it works is whether you supply your real measurement, tag, and field names instead of letting the model produce plausible ones. Constrain the queries around aggregation and gap handling, validate that every panel actually returns data, and treat the result as a strong first draft to refine rather than a finished dashboard.
Related articles:
- Connecting Machine Data to Grafana
- Streaming Machine Data with MQTT
- How Do You Stop AI from Hallucinating When Building IIoT Dashboards?
- SQL vs. Time-Series Database for Industrial Data
- MDCplus Machine Connectivity & Integrations
About MDCplus
Our key features are real-time machine monitoring for swift issue resolution, power consumption tracking to promote sustainability, computerized maintenance management to reduce downtime, and vibration diagnostics for predictive maintenance. MDCplus's solutions are tailored for diverse industries, including aerospace, automotive, precision machining, and heavy industry. By delivering actionable insights and fostering seamless integration, we empower manufacturers to boost Overall Equipment Effectiveness (OEE), reduce operational costs, and achieve sustainable growth along with future planning.
Ready to increase your OEE, get clearer vision of your shop floor, and predict sustainably?
Other articles
14.08.2026
How Do You Build a Mobile Dashboard Plant Managers Actually Use?
Building a mobile-first Tailwind PWA for plant managers: what belongs on a phone screen, offline behavior, push notifications, and prompts for an executive manufacturing dashboard
Read more
13.08.2026
How Do You Create Manufacturing KPI Widgets with Cursor and v0.dev?
Using v0.dev to generate manufacturing KPI widgets and Cursor to wire them into an existing dashboard repo: the two-tool workflow, prompts for scrap rate and MTTR/MTBF, and integration pitfalls
Read more
12.08.2026
How Do You Build a 3D Shop Floor Map Driven by Live PLC Data?
Building a 3D shop floor map with React Three Fiber: preparing CAD geometry for the web, mapping PLC tags to mesh colors, performance limits, and when 3D is the wrong choice.
Read more
11.08.2026
How Do You Design an Andon Display For Shop-Floor Using AI?
Prompting UI/UX for shop floor Andon displays: type scale for distance viewing, colorblind-safe status coding, glare and glove constraints, and prompts that produce factory-ready screens
Read more
10.08.2026
How Do You Get Live OPC UA Machine Data into Retool?
How to vibe-code a Retool custom component that streams live OPC UA machine data over WebSockets: the bridge service, security boundaries, and prompts for each layer
Read more