Make production transparent. Try MDCplus
Try it yourself Get guided demo29 July 2026
Connecting Machine Data to Grafana - How-To Guide
How to connect machine monitoring data to Grafana: data source options, typical architecture with time-series databases, building dashboards and alerts, and how it compares to Power BI
Why Grafana is great for technical dashboards?
Grafana comes from a different world than most manufacturing BI tools — it grew up monitoring servers and infrastructure, built specifically around time-series data and real-time visualization. That heritage makes it a strong fit for machine monitoring dashboards specifically, especially where the audience is technical and the priority is current, live status rather than polished business reporting. This article covers how machine data typically gets into Grafana and what it's actually good at.
Contents:
- What Grafana is, and why it fits machine data
- Data source options
- Typical architecture
- Building machine monitoring dashboards
- Alerting on machine events
- Grafana vs. Power BI
- Common pitfalls
- Frequently asked questions
- Conclusion
What Grafana is, and why it fits machine data
Grafana is an open-source visualization and dashboarding platform originally built for monitoring infrastructure and application metrics, with time-series data as its native use case from the start. That heritage translates directly to machine monitoring: Grafana is built to display exactly the kind of data covered in our time-series data primer — timestamped values from many sources, queried and refreshed frequently, often in near-real-time. It's a strong fit for technical dashboards intended for engineers, maintenance teams, or shop floor operations staff who want live status rather than the more business-report-oriented output typical of tools like Power BI.
Data source options
- Native time-series database plugins. Grafana has built-in or well-supported plugins for popular time-series databases, making it a natural front end when machine data is already stored in one, as discussed in our SQL vs. time-series database comparison.
- SQL database connectors. Grafana also supports standard relational databases directly, useful when machine data (or the metadata needed alongside it) lives in a SQL store.
- JSON API data sources. For platforms that expose data through a REST API rather than direct database access, Grafana can query a JSON API data source, similar in concept to the API integration pattern covered in feeding machine data into custom systems via API.
- Plugin ecosystem. Beyond the core options, Grafana has a large community plugin ecosystem covering many additional data sources, which is worth checking before assuming a custom integration is necessary.
Typical architecture
A common pattern pairs Grafana directly with a time-series database that's already receiving machine telemetry — the database handles storage and query performance, and Grafana handles visualization on top of it, with minimal transformation happening in Grafana itself. Where data arrives via streaming (such as MQTT), it typically lands in the time-series database first, with Grafana querying that store rather than consuming the stream directly. This separation of concerns — storage and query performance handled by the database, visualization handled by Grafana — is a large part of why the pairing works well for high-frequency machine data specifically.
Building machine monitoring dashboards
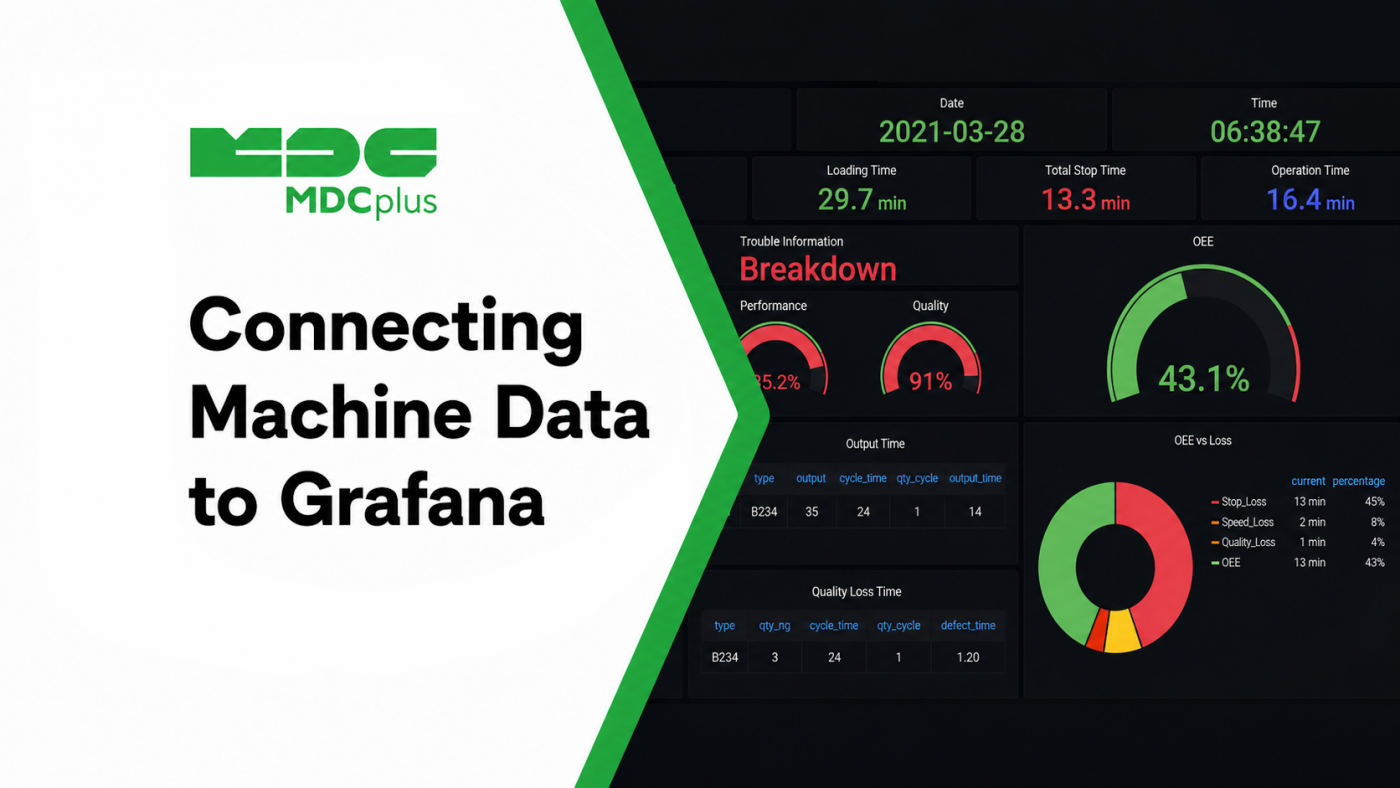
- Panels per signal or metric. Grafana dashboards are built from panels, each typically showing one query result — a time-series chart of spindle load, a gauge for current utilization, a table of recent alarms.
- Template variables for machine selection. Rather than building a separate dashboard per machine, Grafana's templating feature lets a single dashboard definition be reused across machines, with a dropdown to switch which one is displayed.
- Time range controls. Native, built-in time range selection lets viewers zoom into a specific window (last hour, last shift, custom range) without needing separate dashboards for different time scales.
- Combining multiple data sources on one dashboard. A single Grafana dashboard can pull from more than one data source simultaneously, useful when machine telemetry and, say, a separate maintenance log live in different stores.
Alerting on machine events
Grafana includes native alerting, letting a dashboard panel's query trigger a notification when a value crosses a defined threshold — a spindle load consistently over a limit, a machine offline for longer than expected. This overlaps conceptually with the event-driven patterns covered in our piece on webhooks for real-time machine events, though Grafana's alerting evaluates based on the data it's already querying rather than receiving pushed events directly; it's a useful complementary layer when the underlying monitoring platform itself doesn't already cover a specific alert condition.
Grafana vs. Power BI
| Dimension | Grafana | Power BI |
|---|---|---|
| Primary strength | Real-time, time-series visualization | Business reporting, combining diverse data sources |
| Typical audience | Engineers, maintenance, technical operations | Plant managers, executives, business analysts |
| Refresh cadence | Native support for frequent, near-real-time refresh | Scheduled refresh by default, streaming as a separate feature |
| Licensing | Open source (with paid cloud/enterprise tiers) | Commercial, per-user/capacity licensing |
Many manufacturers end up using both: Grafana for live, technical shop-floor dashboards, and our Power BI integration for business-facing reporting that combines machine data with broader company data.
Common pitfalls
- Querying raw data directly for dashboards showing long time ranges. A panel showing months of history built from unaggregated raw data can be slow; using a data source's built-in downsampling or a coarser aggregation for long ranges keeps dashboards responsive.
- Too many panels on one dashboard. Dense dashboards with dozens of panels querying simultaneously can strain both the data source and the viewer's ability to actually parse what matters.
- No access control planning. Grafana supports role-based access, but it needs to be configured deliberately, especially if dashboards are exposed more broadly than intended.
- Treating Grafana alerts as a replacement for a monitoring platform's own alerting. Grafana alerting works well as a supplementary layer but depends on Grafana's own uptime and query access; critical alerts are often better handled at the source platform level as well, not exclusively in the visualization layer.
Frequently asked questions
Do I need a time-series database to use Grafana for machine data?
Not strictly — Grafana can connect to SQL databases and APIs as well — but a time-series database is the more natural pairing given Grafana's design around that kind of data and generally provides better performance for the frequent, time-range-based queries Grafana dashboards typically generate.
Is Grafana free to use for manufacturing dashboards?
The open-source, self-hosted version of Grafana is free to use. Grafana Labs also offers paid cloud and enterprise tiers with additional features and support, which some organizations prefer over self-hosting.
Can Grafana replace a dedicated monitoring platform's dashboards?
It can serve as an additional or alternative visualization layer, but a dedicated monitoring platform typically handles data collection, calculation logic, and alerting internally as well — Grafana is generally complementary, visualizing data that's already been collected and processed elsewhere, rather than a full replacement for the underlying platform.
Should I use Grafana or Power BI for machine data dashboards?
It depends on the audience and use case. Grafana tends to suit real-time, technical dashboards for engineers and operations staff; Power BI tends to suit business reporting that combines machine data with other company data for management and executives. Many manufacturers use both for their respective strengths.
Conclusion
Grafana's roots in infrastructure and time-series monitoring make it a natural fit for real-time, technical machine data dashboards, particularly when paired with a time-series database already receiving telemetry. It's less suited to polished business reporting that combines many diverse data sources — that's where a tool like Power BI tends to be the better fit — but for live, operational visibility into what machines are doing right now, Grafana is a strong, widely adopted choice.
Related articles:
- Integrating Machine Data with Power BI
- SQL vs. Time-Series Database for Industrial Data
- Streaming Machine Data with MQTT
- Top Free Data Visualization Tools for Manufacturing
- MDCplus Machine Connectivity & Integrations
About MDCplus
Our key features are real-time machine monitoring for swift issue resolution, power consumption tracking to promote sustainability, computerized maintenance management to reduce downtime, and vibration diagnostics for predictive maintenance. MDCplus's solutions are tailored for diverse industries, including aerospace, automotive, precision machining, and heavy industry. By delivering actionable insights and fostering seamless integration, we empower manufacturers to boost Overall Equipment Effectiveness (OEE), reduce operational costs, and achieve sustainable growth along with future planning.
Ready to increase your OEE, get clearer vision of your shop floor, and predict sustainably?
Other articles
14.08.2026
How Do You Build a Mobile Dashboard Plant Managers Actually Use?
Building a mobile-first Tailwind PWA for plant managers: what belongs on a phone screen, offline behavior, push notifications, and prompts for an executive manufacturing dashboard
Read more
13.08.2026
How Do You Create Manufacturing KPI Widgets with Cursor and v0.dev?
Using v0.dev to generate manufacturing KPI widgets and Cursor to wire them into an existing dashboard repo: the two-tool workflow, prompts for scrap rate and MTTR/MTBF, and integration pitfalls
Read more
12.08.2026
How Do You Build a 3D Shop Floor Map Driven by Live PLC Data?
Building a 3D shop floor map with React Three Fiber: preparing CAD geometry for the web, mapping PLC tags to mesh colors, performance limits, and when 3D is the wrong choice.
Read more
11.08.2026
How Do You Design an Andon Display For Shop-Floor Using AI?
Prompting UI/UX for shop floor Andon displays: type scale for distance viewing, colorblind-safe status coding, glare and glove constraints, and prompts that produce factory-ready screens
Read more
10.08.2026
How Do You Get Live OPC UA Machine Data into Retool?
How to vibe-code a Retool custom component that streams live OPC UA machine data over WebSockets: the bridge service, security boundaries, and prompts for each layer
Read more