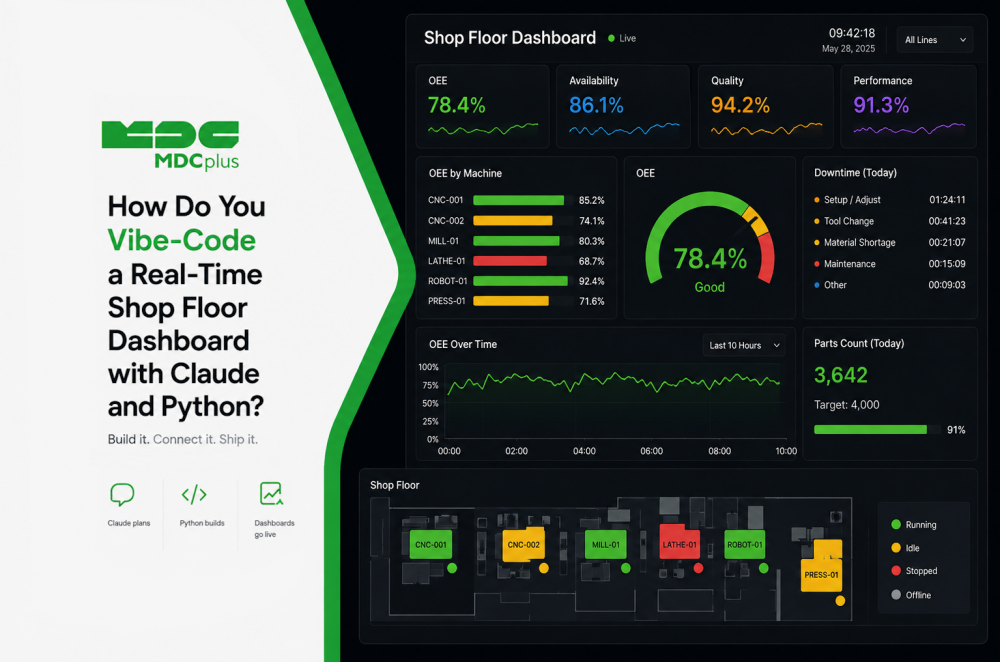
Make production transparent. Try MDCplus
Try it yourself Get guided demo03 August 2026
How Do You Vibe-Code a Real-Time Shop Floor Dashboard with Claude and Python?
How to vibe-code a real-time shop floor dashboard using Claude and Python: the stack, a copy-paste starter prompt, hot-reloading UI, and moving from mock data to a real telemetry feed
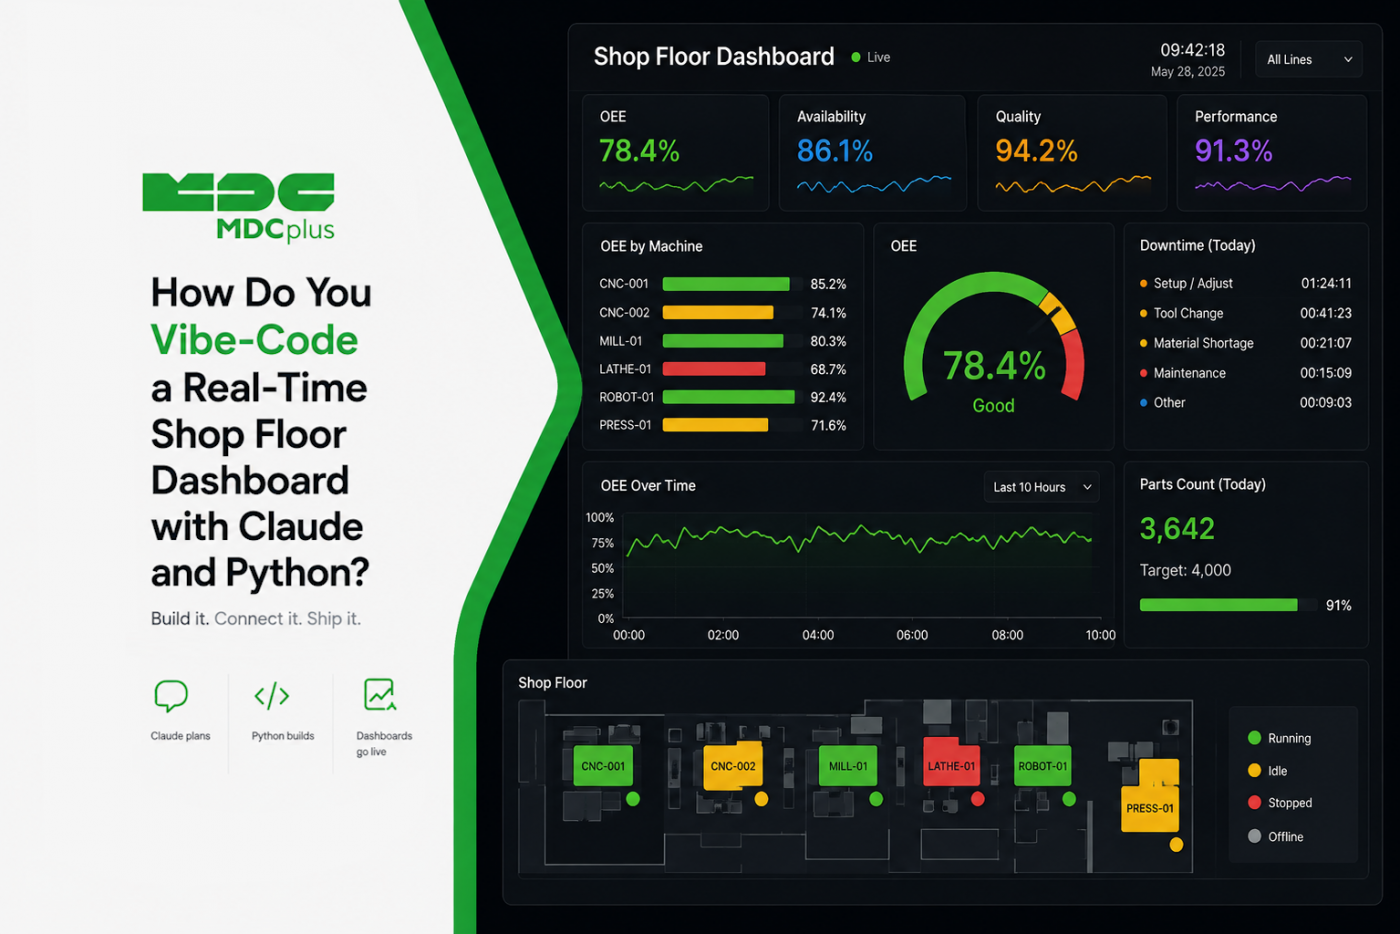
How Do You Vibe-Code a Real-Time Shop Floor Dashboard with Claude and Python?
Short answer: describe the dashboard you want in plain language, let Claude scaffold a Streamlit app against mock telemetry first, then swap in a real data source once the layout and update behavior work the way you want. "Vibe-coding" — describing what you want and letting an AI model write, run, and iterate on the code — has become a genuinely fast way to build internal tools that used to take a developer days to scope and build. A real-time shop floor dashboard is a good first project: the requirements are concrete (show machine status, update live, look decent from across the room), and the iteration loop is short enough that you can watch it come together in real time. The rest of this article walks through the stack, a starter prompt you can copy directly, and how to go from a mock data demo to something reading real telemetry.
Copy this prompt to get started
Paste this into Claude (Opus is worth the extra reasoning for this kind of multi-file scaffolding; Sonnet is a solid faster option once you're iterating) to get a working first version:
Act as a senior manufacturing solutions architect. Build a real-time shop floor dashboard in Python using Streamlit. Connect it to a mock factory telemetry stream (simulate 5–8 machines with status, cycle time, and spindle load updating every few seconds). The UI should update live without a manual page refresh. Structure the code so the mock data source can later be swapped for a real API or MQTT feed without rewriting the dashboard layer.
Contents:
- What vibe-coding means for shop floor tools
- Choosing the stack: Streamlit, FastAPI, or both
- Building the mock telemetry layer first
- Prompting for live, hot-reloading updates
- The iteration prompts that do the real work
- From mock data to a real telemetry feed
- Making it actually shop-floor ready
- Common pitfalls when vibe-coding dashboards
- Where this fits on a maturity curve
- Frequently asked questions
- Conclusion
What vibe-coding means for shop floor tools
Vibe-coding, in this context, means describing the dashboard you want in natural language and having Claude write the actual application code, run it, and iterate based on your feedback — rather than you writing every line yourself or configuring a low-code platform's drag-and-drop builder. For internal manufacturing tools specifically, this is a good fit: shop floor dashboards are usually well-defined enough to describe clearly, small enough in scope for an AI model to hold the whole thing in context, and iterated on frequently enough (new machine added, new metric requested) that fast, prompt-driven changes save real time compared to a formal development cycle.
It's worth being precise about what this does and doesn't replace. It doesn't replace the data collection layer — the protocols, edge devices, and validation covered across the rest of this blog still have to work correctly underneath. What it replaces is the weeks-long cycle of specifying, scheduling, and building a custom view on top of data you already have, which is often the real bottleneck between "we're collecting the data" and "the people who need it can actually see it the way they need to."
Choosing the stack: Streamlit, FastAPI, or both
Streamlit is the usual starting point because it turns a Python script into a web app with almost no boilerplate, which matters enormously when you're iterating by prompt rather than hand-writing frontend code — there's simply less surface area for the model to get wrong. But it isn't the only reasonable choice, and picking the wrong one for your situation creates friction later:
| Stack | Best for | Trade-off |
|---|---|---|
| Streamlit only | A single dashboard, one audience, fastest possible first version | Limited layout control; awkward if you later need multiple front ends |
| FastAPI + Streamlit | When the same data needs to feed a dashboard plus something else (mobile view, another tool) | More moving parts to prompt, run, and deploy |
| FastAPI + React/Next.js | Polished, highly custom UI — Andon screens, operator-facing displays | Significantly more code for the model to generate and for you to review |
For a first vibe-coded project, Streamlit alone is almost always the right call. Add FastAPI the moment a second consumer of the same data appears — retrofitting that separation later is more painful than building it in once you know you need it.
Building the mock telemetry layer first
Starting against mock data isn't a shortcut — it's the sequencing that makes the whole approach work. Machine connectivity is usually the slowest, most environment-specific part of a project, and blocking your UI work on it means iterating slowly against a system you can't easily reset or control. A mock generator producing plausible states, cycle times, and loads on a timer lets you get the layout, colors, and update behavior right in minutes rather than days.
The critical detail is the interface between mock and UI. Ask for something like this shape, so that swapping in real data later touches one function rather than the whole app:
def get_machine_states() -> list[dict]:
    """Returns current state for all machines.
    Swap this implementation for a real API/MQTT source later.
    Contract: [{"id": str, "name": str, "status": str,
                "cycle_time_s": float, "spindle_load_pct": float,
                "updated_at": datetime}]
    """
Making the model write that docstring contract explicitly is worth doing — it gives you something concrete to hold the real implementation to later, and it stops the UI code from quietly reaching into mock-specific fields that won't exist in production.
Prompting for live, hot-reloading updates
The detail that separates a genuinely useful shop floor dashboard from a static report is live updating — the screen changing as machine state changes, without someone needing to refresh the page. Generic "make it update live" prompts tend to produce a full-page rerun on a timer, which flickers, loses scroll position, and looks visibly cheap on a wall display.
Be explicit about the mechanism instead. Streamlit supports fragment-based partial updates that redraw only the parts that changed, and asking for that specifically produces a noticeably smoother result:
Refactor the live-updating parts of the dashboard to use Streamlit fragments so only the status tiles and live values redraw on each tick — the page header, filters, and layout should not rerun. Keep the refresh interval configurable in one place at the top of the file.
Two other things worth asking for explicitly at this stage: a visible "last updated" timestamp (so anyone looking at the screen can tell whether the data is stale or the feed has died), and a distinct visual state for "no data received recently" that isn't the same as "machine stopped" — a distinction that matters more than it sounds, and one we go into in our piece on shop floor data quality.
The iteration prompts that do the real work
The starter prompt gets you something running. What actually produces a dashboard people want to look at is the twenty prompts after it. A few patterns that consistently pay off:
- Constrain the change, not just the goal. "Add a downtime reason breakdown as a new panel below the machine grid, without changing the existing grid layout or data contract" produces a reviewable diff. "Add downtime reasons" often produces a partially rewritten app.
- Ask for the failure case explicitly. "What happens in this code if the telemetry source returns an empty list, or a machine disappears from the feed mid-session? Fix any cases where the UI would crash or silently show stale values."
- Make it critique its own output. "Review this dashboard code as a senior engineer would in a code review. List anything that would break with real, messy production data" surfaces issues faster than waiting to discover them live.
- Lock in what works. Once a section is right, say so: "The machine status grid is final — don't modify it in subsequent changes unless I explicitly ask." Models otherwise tend to "improve" working code while addressing something unrelated.
The general principle: treat the model like a fast, capable engineer who has no context on your factory and no memory of why previous decisions were made. Everything that matters needs to be stated.
From mock data to a real telemetry feed
Once the dashboard layout and behavior are working against mock data, swapping in a real source is mostly a matter of replacing the data-fetching function — provided that layer was kept cleanly separated during the initial build, which is exactly why the starter prompt and the docstring contract above ask for that structure explicitly. Depending on your setup, the real feed might come from a REST API polled on an interval, or a streaming MQTT source if you need genuinely real-time push updates rather than periodic polling.
A prompt shaped like this keeps the swap surgical:
Replace only the
get_machine_states()implementation with one that polls [your API] every N seconds, mapping the response to the existing contract in the docstring. Do not modify any UI code. Handle connection failures by returning the last known values with a staleness flag rather than raising, and log the failure.
That last instruction matters more than it looks: a dashboard that goes blank or crashes the moment the network hiccups is worse than one that clearly shows "last updated 4 minutes ago" and keeps displaying.
Making it actually shop-floor ready
A dashboard that looks fine on your laptop often doesn't survive contact with an actual production floor. Things worth prompting for before it goes on a wall:
- Readable from distance. Font sizes and status colors that work at arm's length usually don't work from ten meters. Ask for a display mode with much larger type and high-contrast status colors.
- Colorblind-safe status coding. Red/green status is the manufacturing default and also the most common colorblindness pairing; pairing color with shape or text labels avoids excluding a meaningful share of operators.
- Survives being left running. Memory growth over a multi-day uptime is a real failure mode for quickly-built apps. Ask specifically whether anything in the code accumulates unboundedly over time.
- Recovers on its own. If the machine running the display reboots overnight, the dashboard should come back without someone manually restarting it.
Common pitfalls when vibe-coding dashboards
- No error handling for missing or malformed data. A vibe-coded first draft often assumes every field is always present; ask explicitly for graceful handling of missing values, since real telemetry will eventually have gaps.
- Hardcoded assumptions from the mock data. Field names, value ranges, or machine counts baked in during the mock-data phase can silently break when real data doesn't match those assumptions exactly. Mock data that's too clean is its own trap — ask the model to make the generator emit occasional nulls, out-of-range values, and dropped machines so the UI meets messy data early.
- Recalculating metrics the platform already computes. If your monitoring platform already calculates OEE with validated logic, recomputing it independently in dashboard code risks producing a second, different number for the same thing — and then nobody trusts either one.
- No review of generated code before connecting real data. Read through what was generated, particularly around how data is fetched and parsed, before pointing it at a live system — a plausible-looking dashboard can still contain logic errors that only surface with real, messier data.
- Skipping version control. Fast iterative prompting can produce many changes quickly; committing working versions along the way makes it easy to roll back a change that broke something rather than trying to prompt your way back to a previous state.
- Credentials in the code. API keys pasted inline during a fast iteration session have a way of ending up committed. Ask for environment-variable configuration from the first version that touches a real endpoint.
Where this fits on a maturity curve
A vibe-coded dashboard is usually a fast way to get a specific, custom view that a general-purpose platform doesn't offer out of the box — not necessarily a replacement for a full monitoring platform's own data collection, calculation logic, and reliability guarantees. It fits most naturally once core connectivity is already solid, as covered in our machine data collection roadmap: building custom views on top of already-trustworthy data is a reasonable Phase 5 activity, while vibe-coding a dashboard against unreliable or unvalidated data just produces a fast, good-looking display of numbers that shouldn't be trusted yet.
Frequently asked questions
Which Claude model should I use for this kind of project?
Opus tends to handle the initial multi-file scaffolding and architectural decisions more thoroughly, which is useful for the first version. Sonnet is a strong, faster choice for the many smaller iterations that follow — adjusting a chart, adding a field, fixing a layout issue — once the core structure is in place.
Do I need to know Python to vibe-code a dashboard like this?
Not deeply, but a basic ability to read the generated code and understand roughly what it's doing is valuable — you don't need to write it from scratch, but you should be able to spot an obviously wrong assumption before connecting real machine data to it.
Can this approach scale to a dashboard covering many machines and users?
It can, but a vibe-coded internal tool built quickly is usually not where you want to stop for anything business-critical or widely relied upon — at that point, the same iterative process is worth applying with more deliberate code review, testing, and the reliability practices you'd expect of any production application.
Should I start with mock data or connect real telemetry from the start?
Starting with mock data is usually faster for getting the UI and behavior right, since it removes machine connectivity as a variable while you're iterating on layout and interactivity. Swap in real data once the structure is solid, as covered above.
How long does a first working version actually take?
The first running dashboard against mock data is often a matter of minutes. Getting it genuinely shop-floor ready — real data, error handling, readable from distance, surviving multi-day uptime — is realistically a day or two of iteration, which is still dramatically faster than a traditional development cycle for the same result.
What's the biggest difference between a vibe-coded dashboard and a "real" application?
Usually error handling and edge cases rather than core functionality. The happy path tends to work quickly; what separates a demo from something people rely on is how it behaves when the feed drops, data is malformed, or it's been running untouched for three weeks — all of which are things you have to prompt for deliberately.
Conclusion
A real-time shop floor dashboard is a well-scoped, satisfying first vibe-coding project: concrete requirements, a short feedback loop, and a clear path from mock data to something genuinely useful. The starter prompt above gets you a working version in minutes; the discipline that matters afterward is keeping the data layer separable, reviewing what gets generated before trusting it with real machine data, and treating the result as a fast custom view layered on top of solid data collection, not a replacement for it.
Related articles:
- Feeding Machine Data into Custom Systems via API
- Streaming Machine Data with MQTT
- Building a Machine Data Collection Roadmap
- MDCplus Machine Connectivity & Integrations
About MDCplus
Our key features are real-time machine monitoring for swift issue resolution, power consumption tracking to promote sustainability, computerized maintenance management to reduce downtime, and vibration diagnostics for predictive maintenance. MDCplus's solutions are tailored for diverse industries, including aerospace, automotive, precision machining, and heavy industry. By delivering actionable insights and fostering seamless integration, we empower manufacturers to boost Overall Equipment Effectiveness (OEE), reduce operational costs, and achieve sustainable growth along with future planning.
Ready to increase your OEE, get clearer vision of your shop floor, and predict sustainably?
Other articles
14.08.2026
How Do You Build a Mobile Dashboard Plant Managers Actually Use?
Building a mobile-first Tailwind PWA for plant managers: what belongs on a phone screen, offline behavior, push notifications, and prompts for an executive manufacturing dashboard
Read more
13.08.2026
How Do You Create Manufacturing KPI Widgets with Cursor and v0.dev?
Using v0.dev to generate manufacturing KPI widgets and Cursor to wire them into an existing dashboard repo: the two-tool workflow, prompts for scrap rate and MTTR/MTBF, and integration pitfalls
Read more
12.08.2026
How Do You Build a 3D Shop Floor Map Driven by Live PLC Data?
Building a 3D shop floor map with React Three Fiber: preparing CAD geometry for the web, mapping PLC tags to mesh colors, performance limits, and when 3D is the wrong choice.
Read more
11.08.2026
How Do You Design an Andon Display For Shop-Floor Using AI?
Prompting UI/UX for shop floor Andon displays: type scale for distance viewing, colorblind-safe status coding, glare and glove constraints, and prompts that produce factory-ready screens
Read more
10.08.2026
How Do You Get Live OPC UA Machine Data into Retool?
How to vibe-code a Retool custom component that streams live OPC UA machine data over WebSockets: the bridge service, security boundaries, and prompts for each layer
Read more